At WP Travel Engine, we believe that you shouldn’t have to guess what works for your business. You should know. That’s why we built our first Analytics Dashboard to give you a quick snapshot of your bookings and sales.
But a snapshot only shows one moment. To truly grow, you need to see the whole movie.
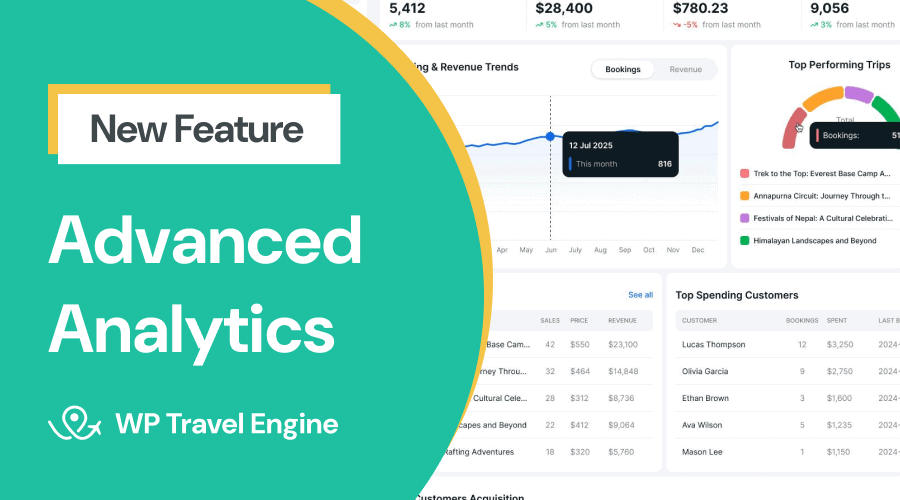
Today, we are thrilled to introduce that leap: Advanced Analytics add-on.
It’s a new way to see the full story behind your numbers, helping you move from basic data to intelligent decisions.
Advanced Analytics add-on
Advanced Analytics is a powerful new tool that offers a deeper view of your travel business’s performance. It goes beyond the main overview to let you analyze the performance of individual parts of your business.
This includes tracking the performance based on destinations, activities, trip types, and extra services. With this level of detail, you can make smarter choices about pricing, marketing, and offerings that need improvement.
It provides an overview, plus detailed reports across several crucial categories:
- Trips
- Destinations
- Activities
- Trip Types
- Customers
- Extra Service
- Accommodation
Access focused reports that reveal key trends and performance across your travel business.
How to access: Dashboard > WP Travel Engine > Analytics
Benefits of Advanced Analytics
- Detailed Performance Breakdown: Pinpoint exactly which tour locations, activities, and extra services are driving growth and which need attention.
- Revenue Optimization: Track the earnings from every part of your business, including small add-ons and accommodation. This helps you find new opportunities to increase the Average Order Value (AOV) of your tours.
- Focus on Improvement Areas: The insights clearly show which trips or destinations are not popular. This helps you decide whether to improve them, change the price, or focus your energy on your best sellers.
- Strategic Product Development: Understanding which trip types (like ‘Adventure’ or ‘Cultural) are selling best gives you clear direction on what to create. This ensures they match what your customers are already buying.
- Informed Decision-Making: Use extensive data on revenue, bookings, and customer interest to optimize your offerings.
What Advanced Analytics Offers
Advanced Analytics is packed with features that provide a detailed view of your travel business. Let’s explore each section and how it delivers value to you.
Overview
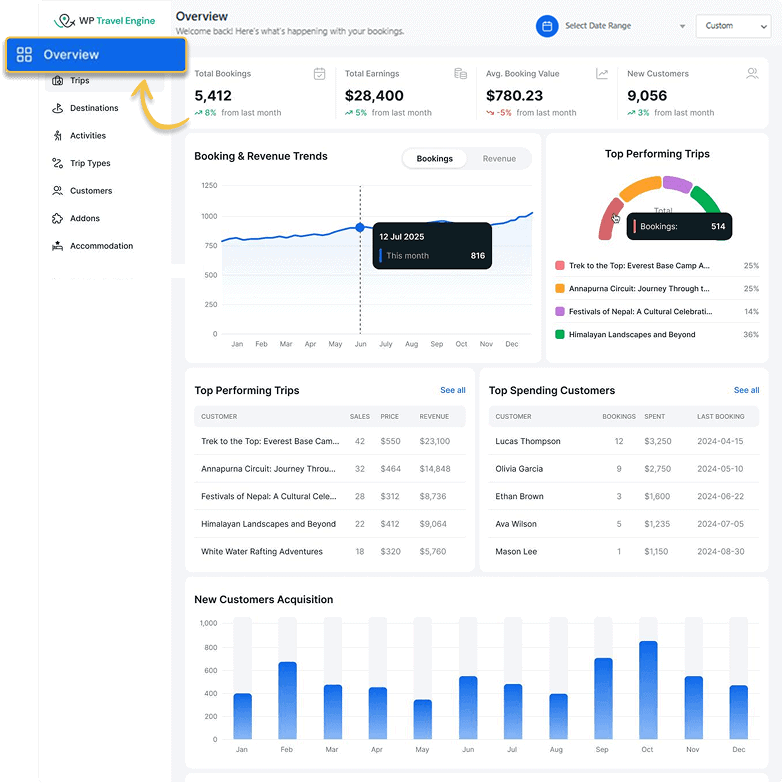
The Overview Dashboard serves as your command center. It offers a detailed snapshot of your business’s performance.
Previously, you could only view basic charts and limited information in the overview. Now, you can see more actionable insights and interactive diagrams.
The Overview dashboard features:
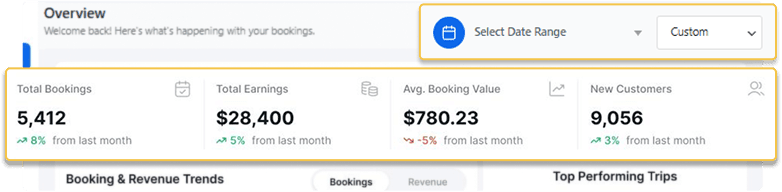
- Key Performance Indicators (KPI)
Track key metrics like total bookings, revenue, booking value, and new customer growth, all updated in real time.
Using the custom date range filter, you can analyze performance over any period.
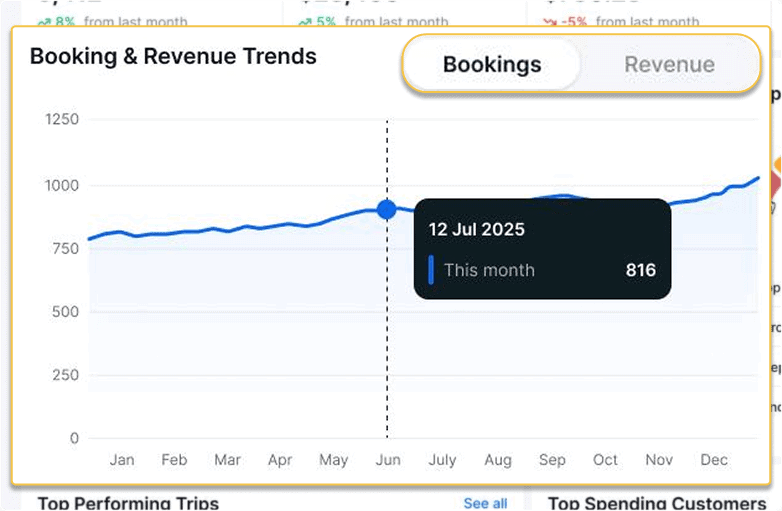
- Booking & Revenue Trends
Switch between bookings and revenue data with interactive charts. You can spot trends, optimize timing, and grow your business with confidence.
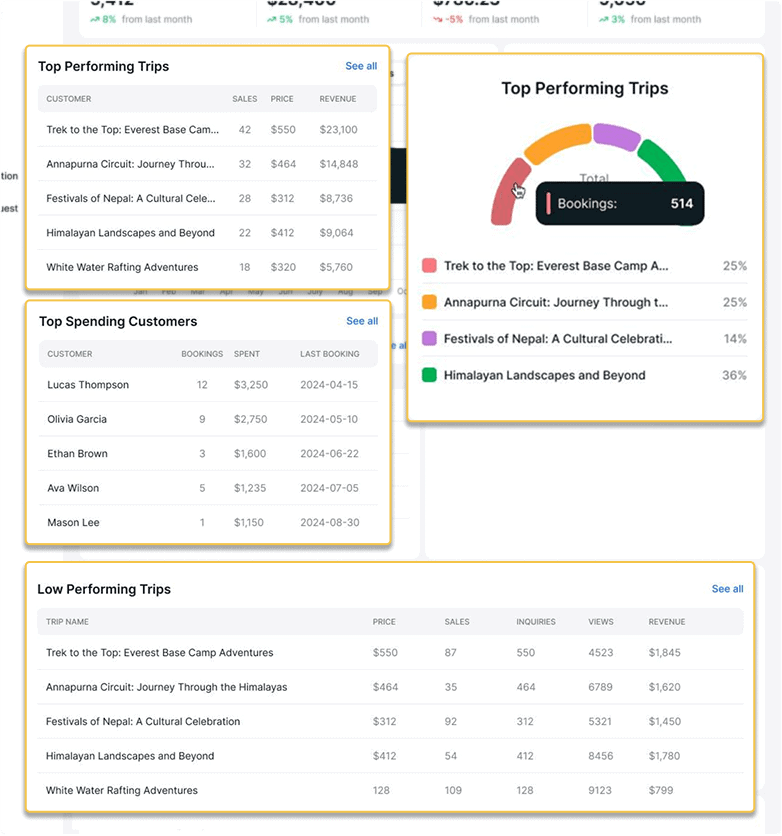
- Low & Top Performers
Explore top and low-performing trips and top-spending customers in easy-to-read charts and lists. Create targeted offers, improve underperforming packages, and focus on what drives the most value.
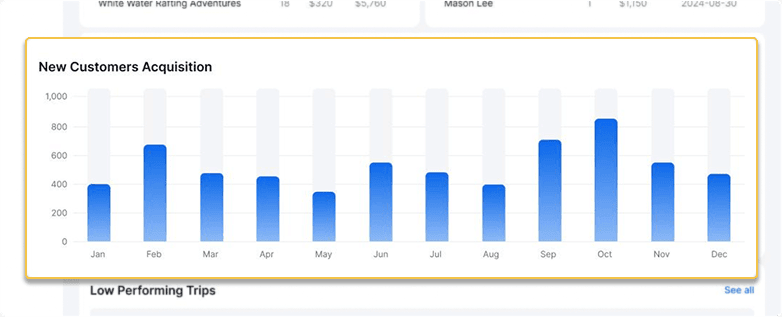
- Customer Insights by Month
Monitor all the new customers that have booked your tours by month using an easy-to-read bar chart.
Why It’s Valuable: The Overview dashboard allows you to assess your business’s health, spot trends, and identify what’s driving success, all at a glance.
Trips

The upgraded Trips section provides a deeper look into the performance of your individual trips. It provides key data to help you optimize the trip packages you offer.
The Trips analysis section includes:
- Trip KPIs
Track data like the best-selling trip, the highest revenue trip, bookings per trip, and revenue per trip. This allows you to keep a close eye on the trips you offer and optimize them as needed.

- Low & Top Performers
Want to know which trips are selling the best and which ones aren’t? The top and low-performance trips chart helps you visualize your booking data in a clear and easy-to-read format.

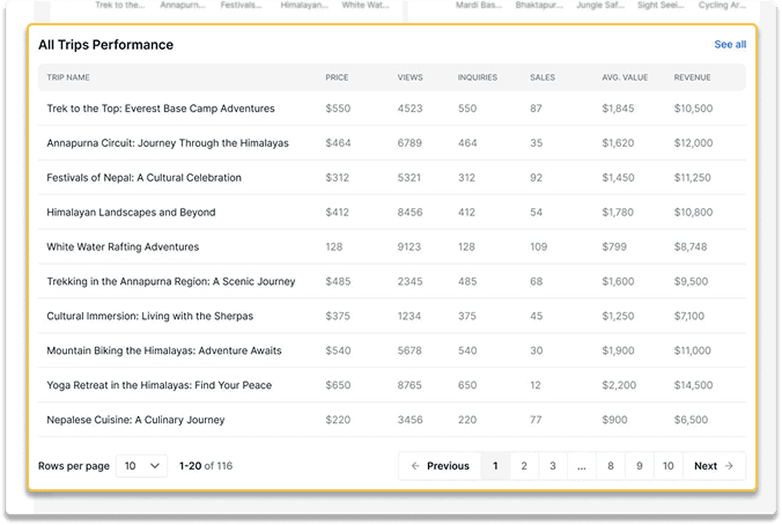
- All Trips Sorted by Performance
All the trips you offer, listed in clear order by performance. You can see the inquiries each trip has, revenue generated, number sold, views, and average value.
Why It’s Valuable: The Trips analysis helps you understand which trips are resonating with customers, as well as ones that need adjustments.
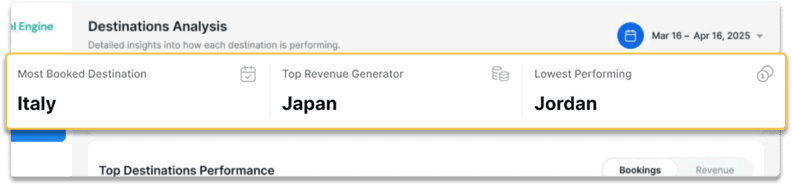
Destinations
The new Destinations section provides insights into the performance of each travel destination. You can see key information to help refine the locations that you offer.
The Destination analysis section offers:
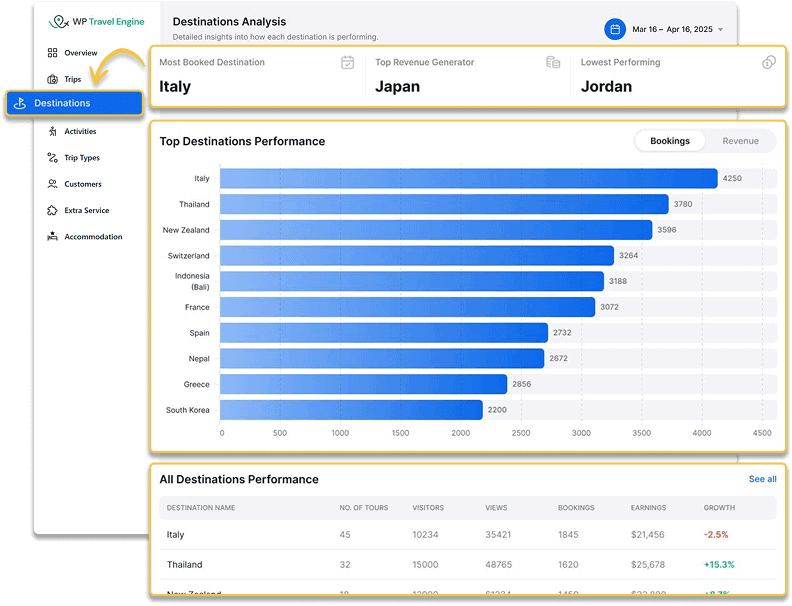
- Destination Performance
Access crucial insights, such as the most booked destination, top revenue generator, and lowest performers.
- Top Performing Destinations
With clear bar charts, you can see which destinations are in front in terms of bookings or revenue. This makes it easy to compare performance between locations.

- All Destinations Sorted by Performance
All your travel destinations, sorted in terms of the number of bookings. You can view metrics such as visitors, views, bookings, revenue, and growth.

Why It’s Valuable: By identifying high-performing and underperforming destinations, you can focus marketing efforts on popular locations and develop strategies to improve others.
Activities
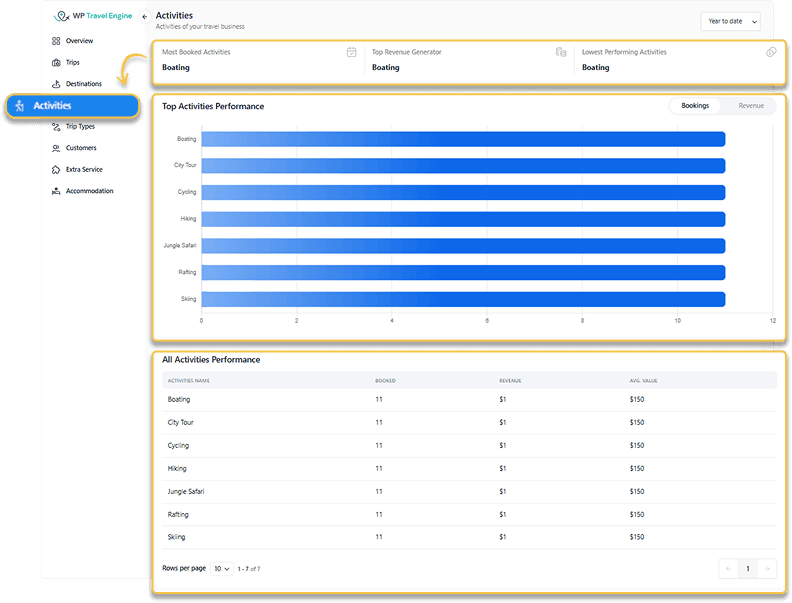
The new Activities section focuses on the performance of individual activities within your trips. These insights offer an in-depth analysis of the trip activities you provide.
The Activities analysis section offers:
- Activities Performance
These insights show you the most popular activities, booking counts, and revenue contributions.

- Top Activities Performers
Similar to the Destinations tab, these include bar charts and tables to compare activity performance.

- All Activities Sorted by Performance
Easily read metrics on bookings, revenue, and customer engagement for all activities that you provide.

Why It’s Valuable: This section helps you identify which activities enhance trip appeal and where to invest in new offerings.
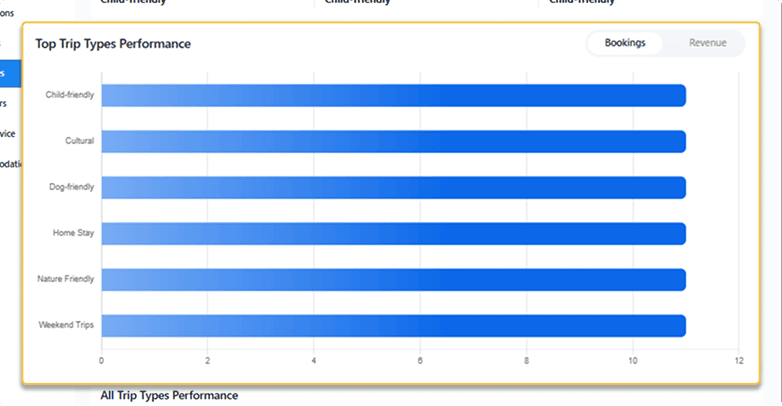
Trip Types
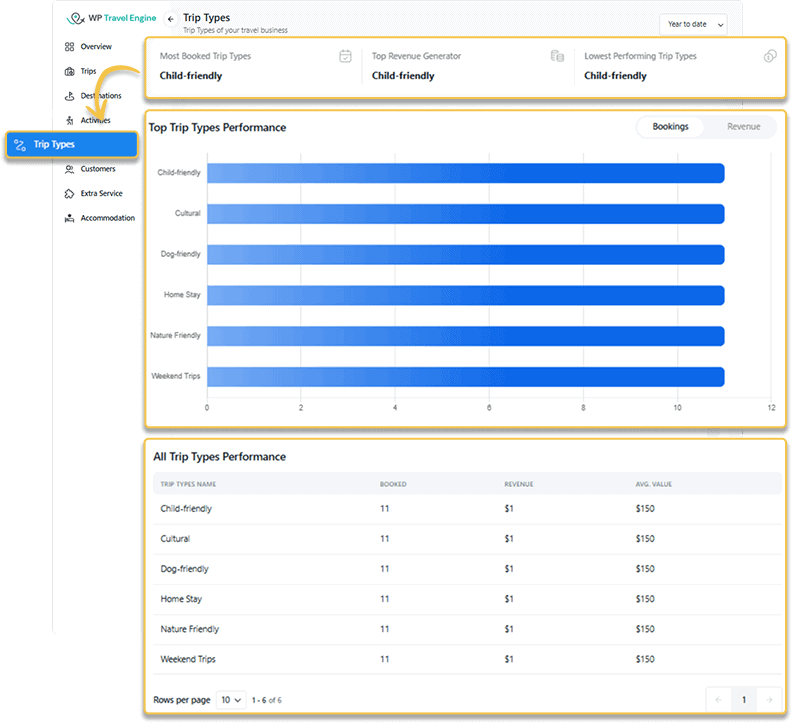
Along with the ‘Trips’ tab, you can now also see performance insights based on the types of trips you offer. With this, you can understand which type of trip (e.g., adventure, cultural, luxury) benefits you the most.
The Trip Types analysis includes:
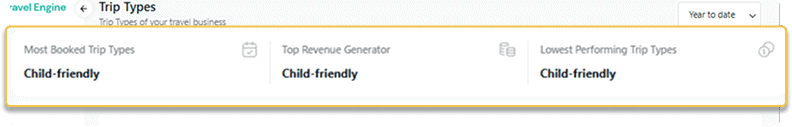
- Trip Type Performance
Track your most and least popular trip types, and the one that generates the most revenue.
- Top Trip Type Performers
Toggle between booking and revenue performance charts across trip types. These help show you how your best-selling trip types compare.
- All Trip Types Sorted by Performance
Access metrics on bookings, revenue, and customer preferences for each trip type you offer.
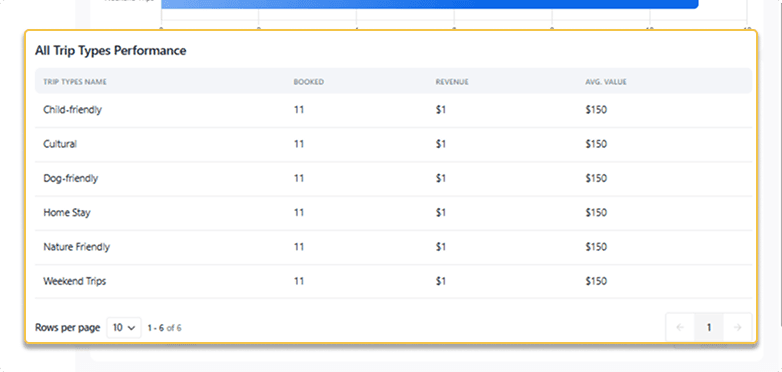
Why It’s Valuable: You can develop and market strategies for the types of trips you offer by understanding what is in demand.
Customers
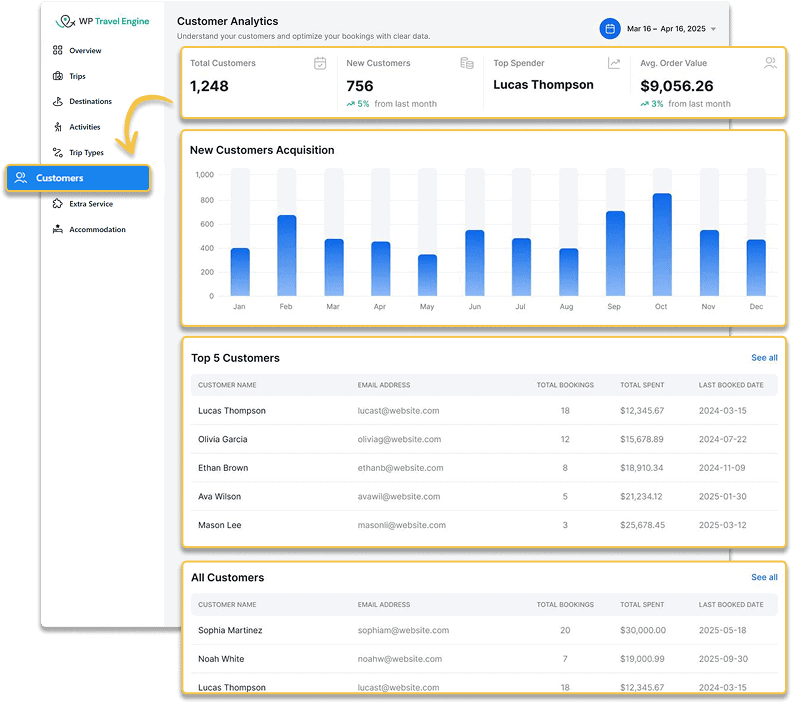
The new Customer analysis offers a detailed look at your customer base. You can use these insights to predict customer behavior and trends, optimizing your offerings.
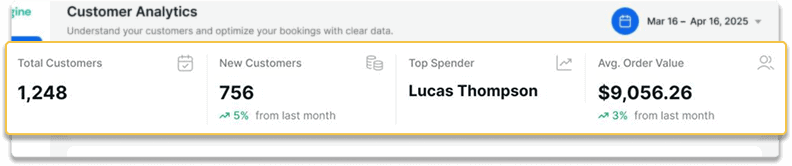
The Customer analysis features:
- Customer KPIs
Track total customers, new customers, top spenders, and order values in a clean, easy-to-read format.
- New Customer Acquisition Chart
See the total number of new customers you’ve gained over time using easy-to-follow charts.

- Top Customer Data
Your top 5 customers and their total bookings, total spendings, and last booking date. You can use this data to reward loyalty, send personalized offers, or understand high-value customer behavior.

- All Customers Sorted by Total Spent
You can view all your customers in a clear, organized table. At a glance, you can see the same details as ‘Top Customers’.
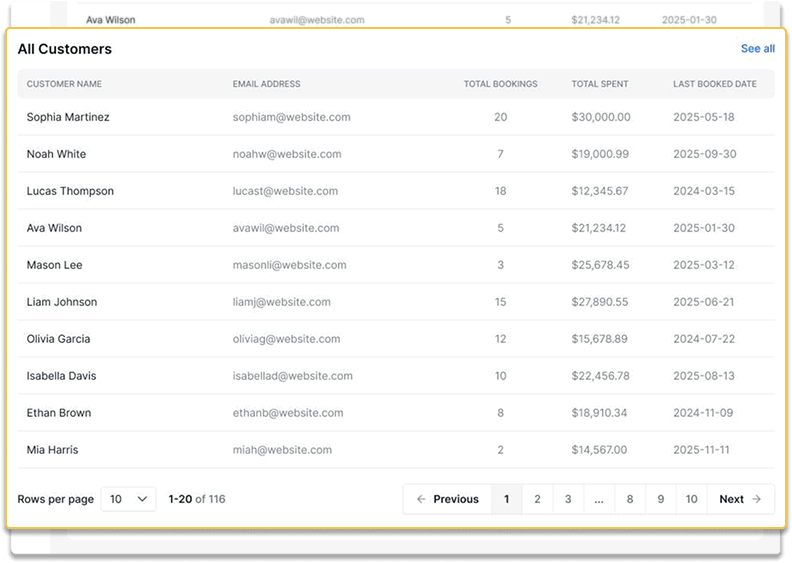
Why It’s Valuable: This section enables you to understand customer behavior, target high-value clients, and personalize tour marketing.
Extra Service

With the Advanced Analytics add-on, you can finally see how your add-ons and extra services are doing. All data about optional tour choices you provide, like airport pickups, insurance, or special meals, are visualized for you.
The Extra Services analysis offers:
- Extra Services Performance
At a glance, see which extra services are getting chosen most and least, and which ones generate the most revenue.

- Top Extra Services Performers
All your top-performing optional services are visualized in a chart showing real-time metrics.

- All Extra Services Sorted by Revenue
Access all your extra services with more detailed information, like bookings, revenue, and order value for each service.
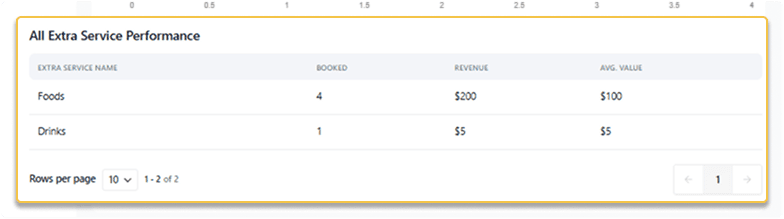
Why It’s Valuable: This section helps you maximize revenue by identifying popular add-ons and opportunities to introduce new services.
Accommodation
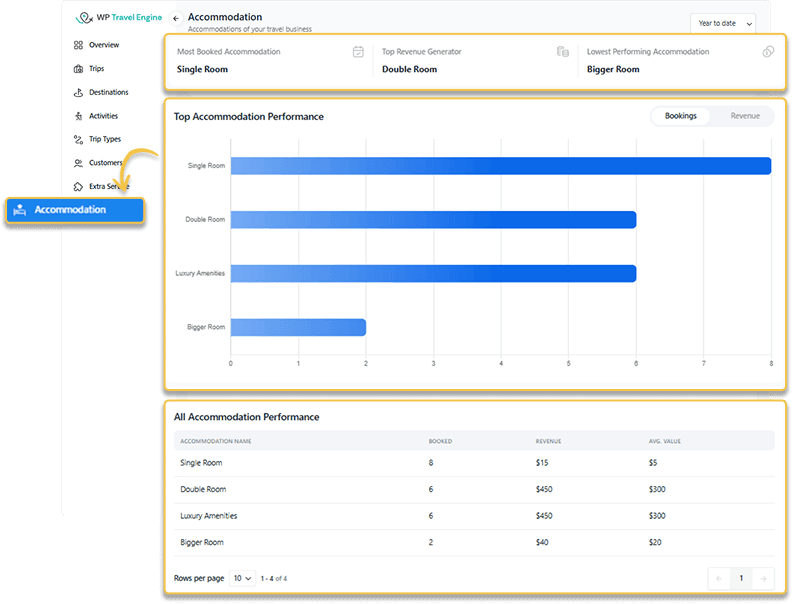
The new Accommodation Analysis section helps you monitor the performance of your lodging options. With precise data on accommodation upsells, you can understand which lodging types are the most popular.
The Accommodation analysis offers:
- Accommodation Performance
See which accommodations are best and worst selling, and which one is generating the most revenue.

- Top Accommodation Performers
Just like Extra Services, you can see your top-performing accommodation options in a chart.

- All Accommodation Sorted by Revenue
See all your accommodation options listed by revenue generation. You can also see metrics on bookings and order value.

Why It’s Valuable: This section informs decisions about accommodation partnerships and pricing to optimize customer experiences.
Don’t guess how your business is doing! Try out Advanced Analytics today and see data-backed numbers that contribute directly to your revenue.
Please share your thoughts about any suggestions or feedback in the comment section below.
If you want to learn more about Advanced Analytics, please visit its documentation. Or, create a support ticket if you have any queries.
What else would you like added to Advanced Analytics? Our team is eagerly waiting to hear your side of the story.


